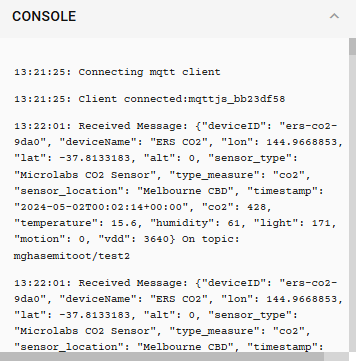
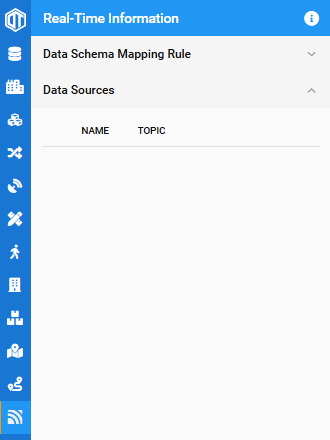
Mapping rules are essential to locate data accurately within each MQTT message. This step ensures the Digital Twin (DT) platform understands where to find each piece of data such as time, device identifier, and other relevant data fields. Without mapping rules, DT is unable to find the information for every format of the MQTT message. Start the process by clicking on Real-Time information, then expand the Data Schema Mapping rule where you can add a new rule.
How to Define Mapping Rules
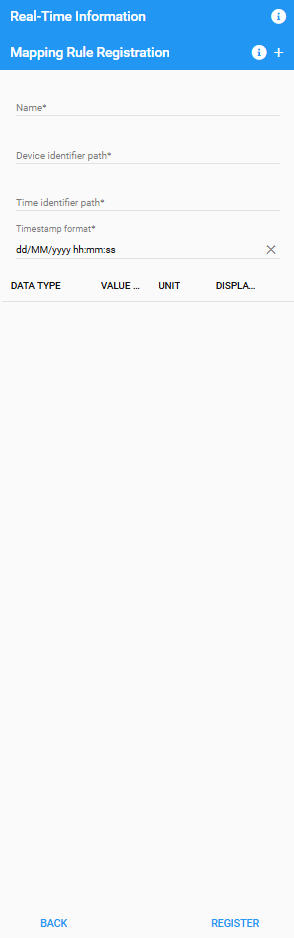
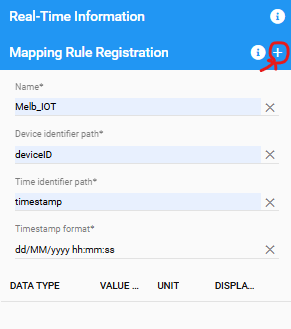
After clicking on Add a new rule you need to define the following fields.
- Name: Specify a name for your mapping rule.
- Device Identifier Path: Define the path to find your device identifier.
- Time Identifier Path: Specify the path to find your timestamp information.
- Timestamp Format: Indicate the format of your timestamp (e.g., yyyy-MM-dd’T’HH:mm:ssXXX).
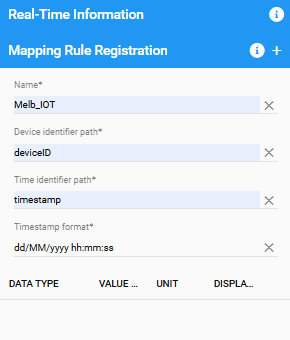
Example:
- Name: Melb_IOT
- Device Identifier Path: deviceID
- Time Identifier Path: timestamp
- Timestamp Format: yyyy-MM-dd’T’HH:mm:ssXXX
Add Observation Rules
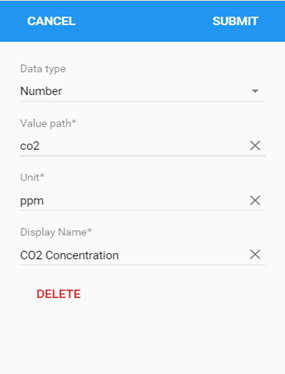
- Click the “+” button to add mapping entries for each observation.
- Define the data type, value path, unit, and display name for each observation. These should match the fields in the data being published by your Python script.
These rules or factors are going to be displayed in the diagram. For each factor (e.g., CO2, temperature, humidity), you need to specify:
- Data Type: Number or String.
- Value Path: Field you are reading your data from (e.g., co2).
- Unit: Unit of the measurement (e.g., ppm for CO2).
- Display Name: Name to display on the diagram (e.g., CO2 Concentration).
Example:
- Data Type: Number (Double)
- Value Path: co2
- Unit: ppm
- Display Name: CO2 Concentration
You can define multiple factors such as temperature, humidity, light, etc. Ensure these are correctly received via your Python code that uses API or spreadsheet and publishes the data.
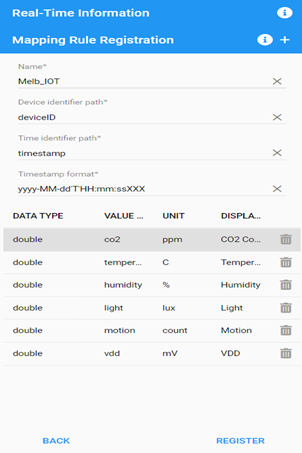
Note:
Ensure that each of these factors has a corresponding entry in the Python script’s JSON payload. This ensures the data collected from your sensors is correctly mapped and visualized.